


Farm-to-Table International Economics
Knowing that (X-M)=(S-I)+(T-G) is absolutely essential to understanding international trade and finance. Here, we turn two towns and two crops into numerical tables to make the equation intuitive.

For me, the humble equation, (X-M)=(S-I)+(T-G) is the closest thing economics has to E=mc²—a simple formula, packed with worlds of insight, and utterly nonintuitive. This equation says, among other things, that simultaneously increasing foreign investment in America and reducing America’s trade deficit is no more possible than is traveling faster than the speed of light.* This principle comes not from rarefied academic navel-gazing, but rather from simple bookkeeping principles, writ large.
My recent “Real-World Trade-Deficit Math-Magic” presented this equation and the two from which it is derived. Readers asked followup questions, and today’s essay is the second of two posts responding to those queries.
The first, “The Other Manhattan Project,” described the development of the National Income and Product Accounts (NIPA) during World War II, the NIPAs’ role in winning that war, parallels between the NIPA and the development of the atom bomb, the economist (Simon Kuznets) who developed the NIPA, and the centuries-old rules of double-entry bookkeeping/accounting that gave the NIPA their logical structure.
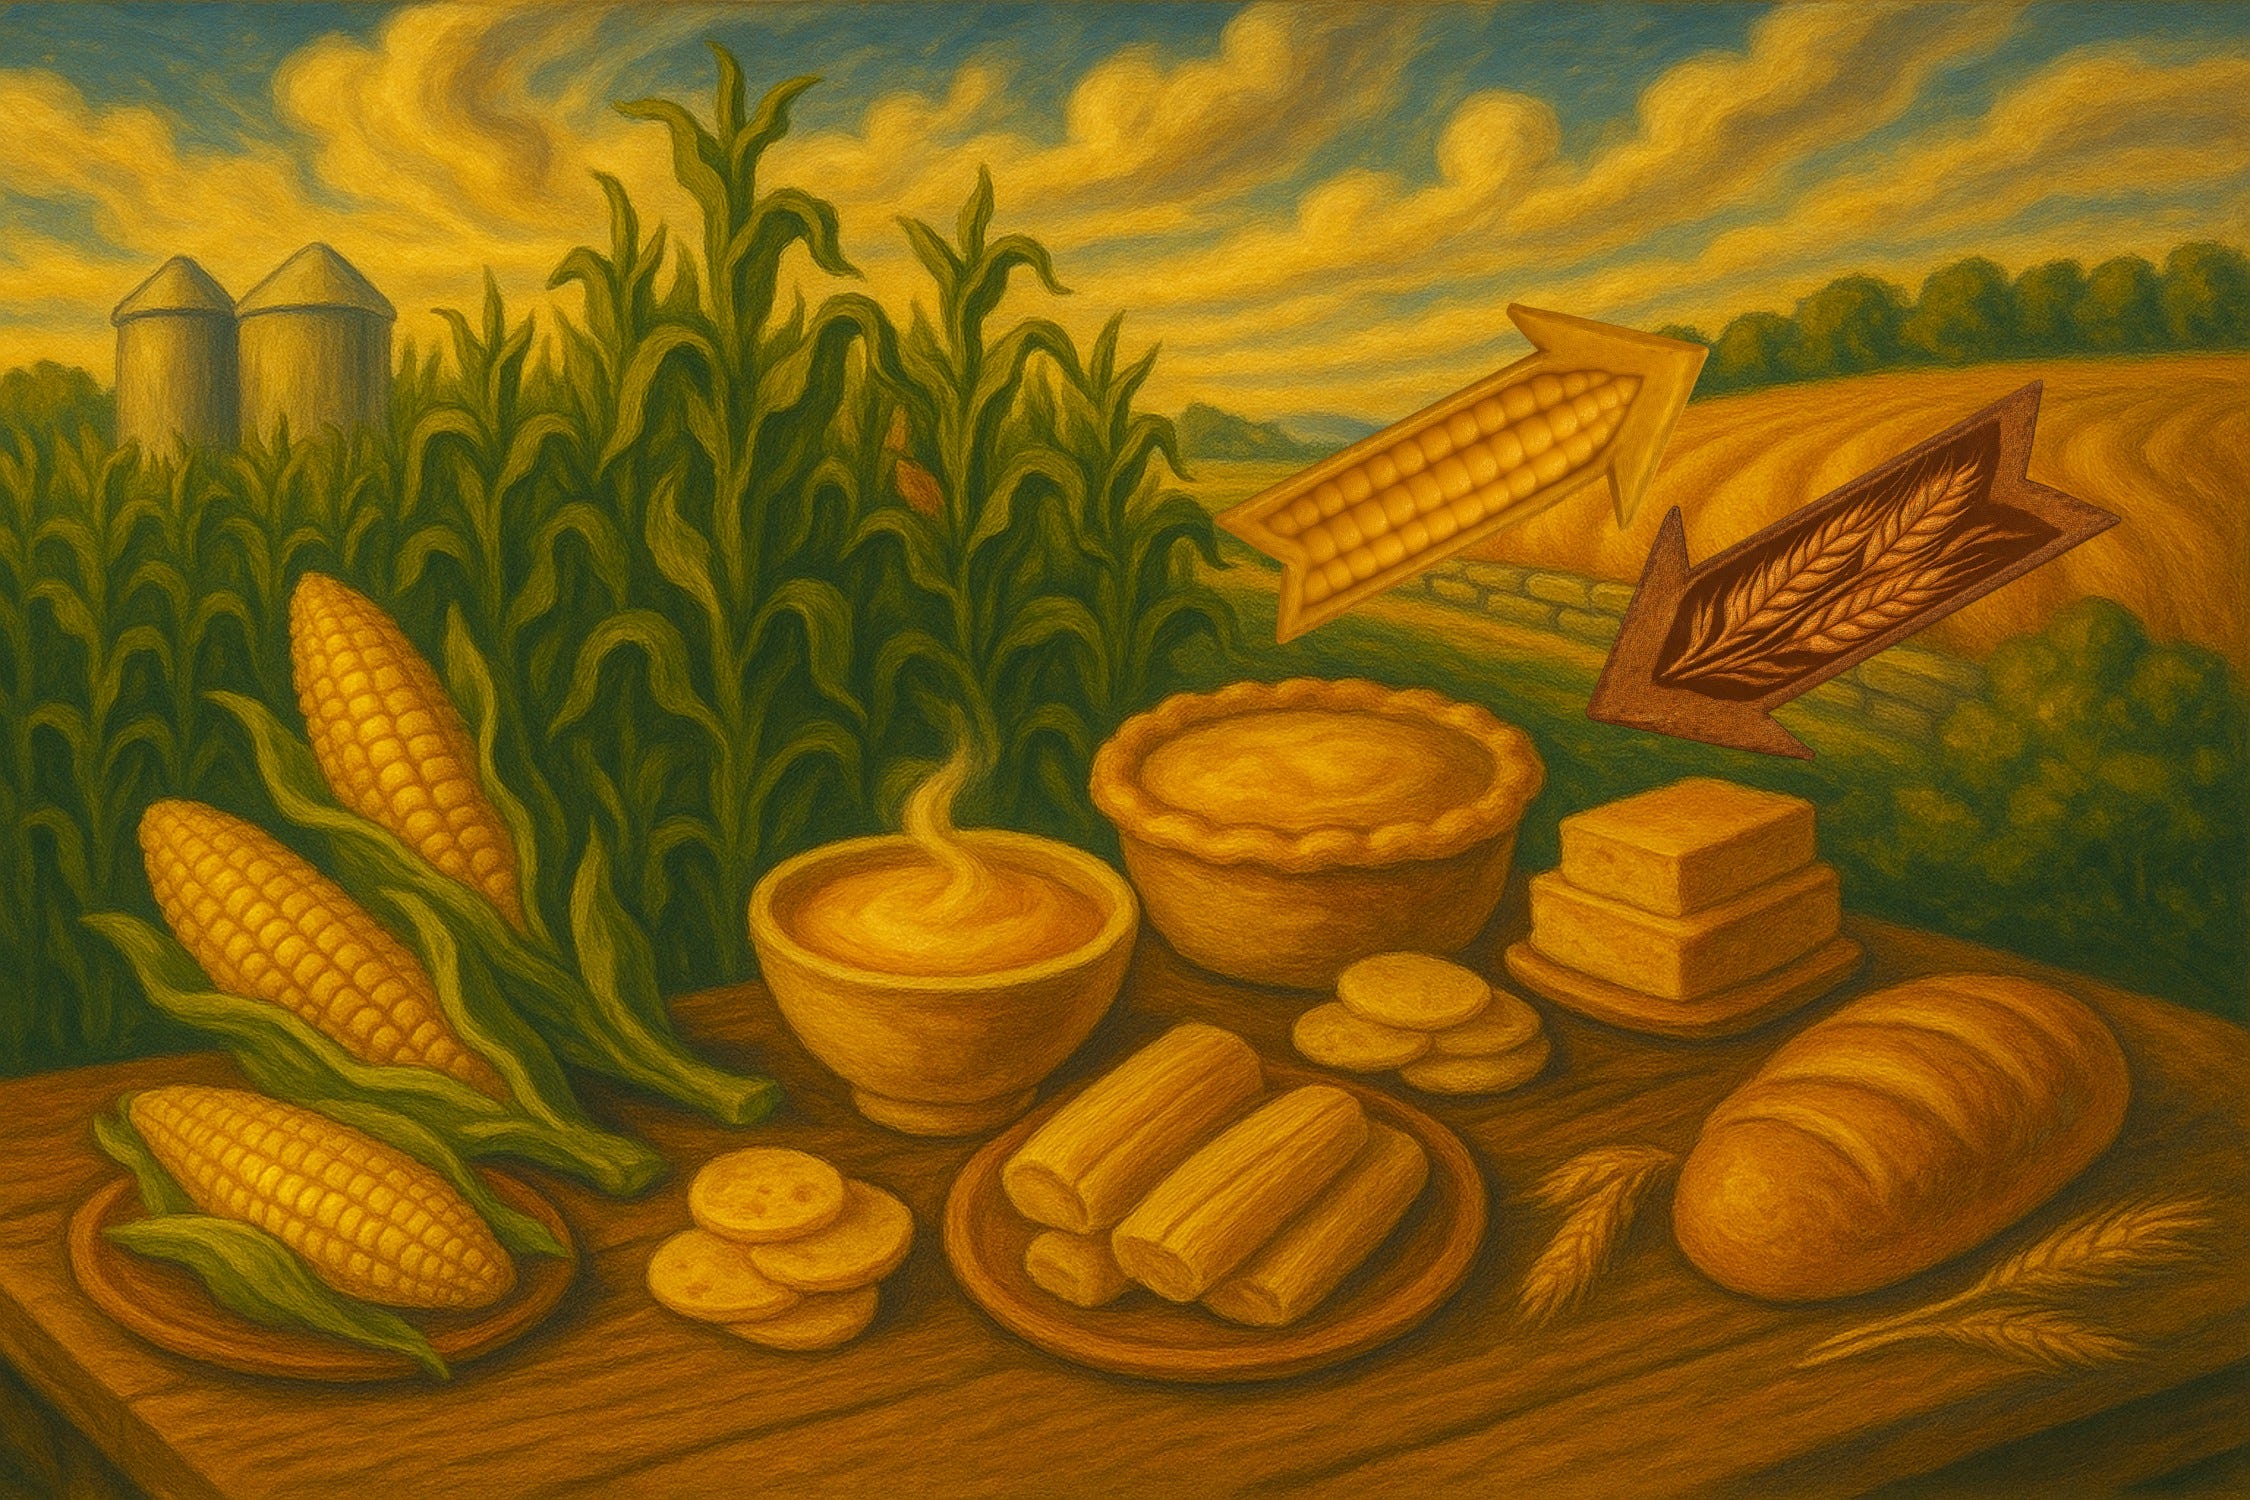
In this second essay, we dig deeper into the derivation and implications of the three equations. We imagine two small towns, each of which produces one crop. Hereville grows corn and sells some to Thereville. Thereville grows wheat and sells some to Hereville. The illustrated tables below show:
Production of physical quantities of corn and wheat;
Capital (investment) flows that finance shipments between the two towns;
Income statistics produced by rearranging the data on grain production;
Spending statistics produced by rearranging the data on grain production;
Revelations that come from merging the income and spending tables; and
Relationships found in the Balance of Payments Identity: (X-M)=(S-I)+(T-G)].
The math isn’t complicated, but you may have to stare at the tables a bit. With Washington, DC, all aflutter over tariffs and trade, understanding these three little equations will make you smarter than the vast majority of policymakers at the White House or on Capitol Hill—of either party.
* To be precise this statement refers to net foreign investment in America (more coming in than going out) and to trade as defined by the current account, which includes services, among other things.
WHICH EQUATIONS, AND WHY SHOULD WE CARE?
This section is taken (with some edits) from “The Other Manhattan Project.”
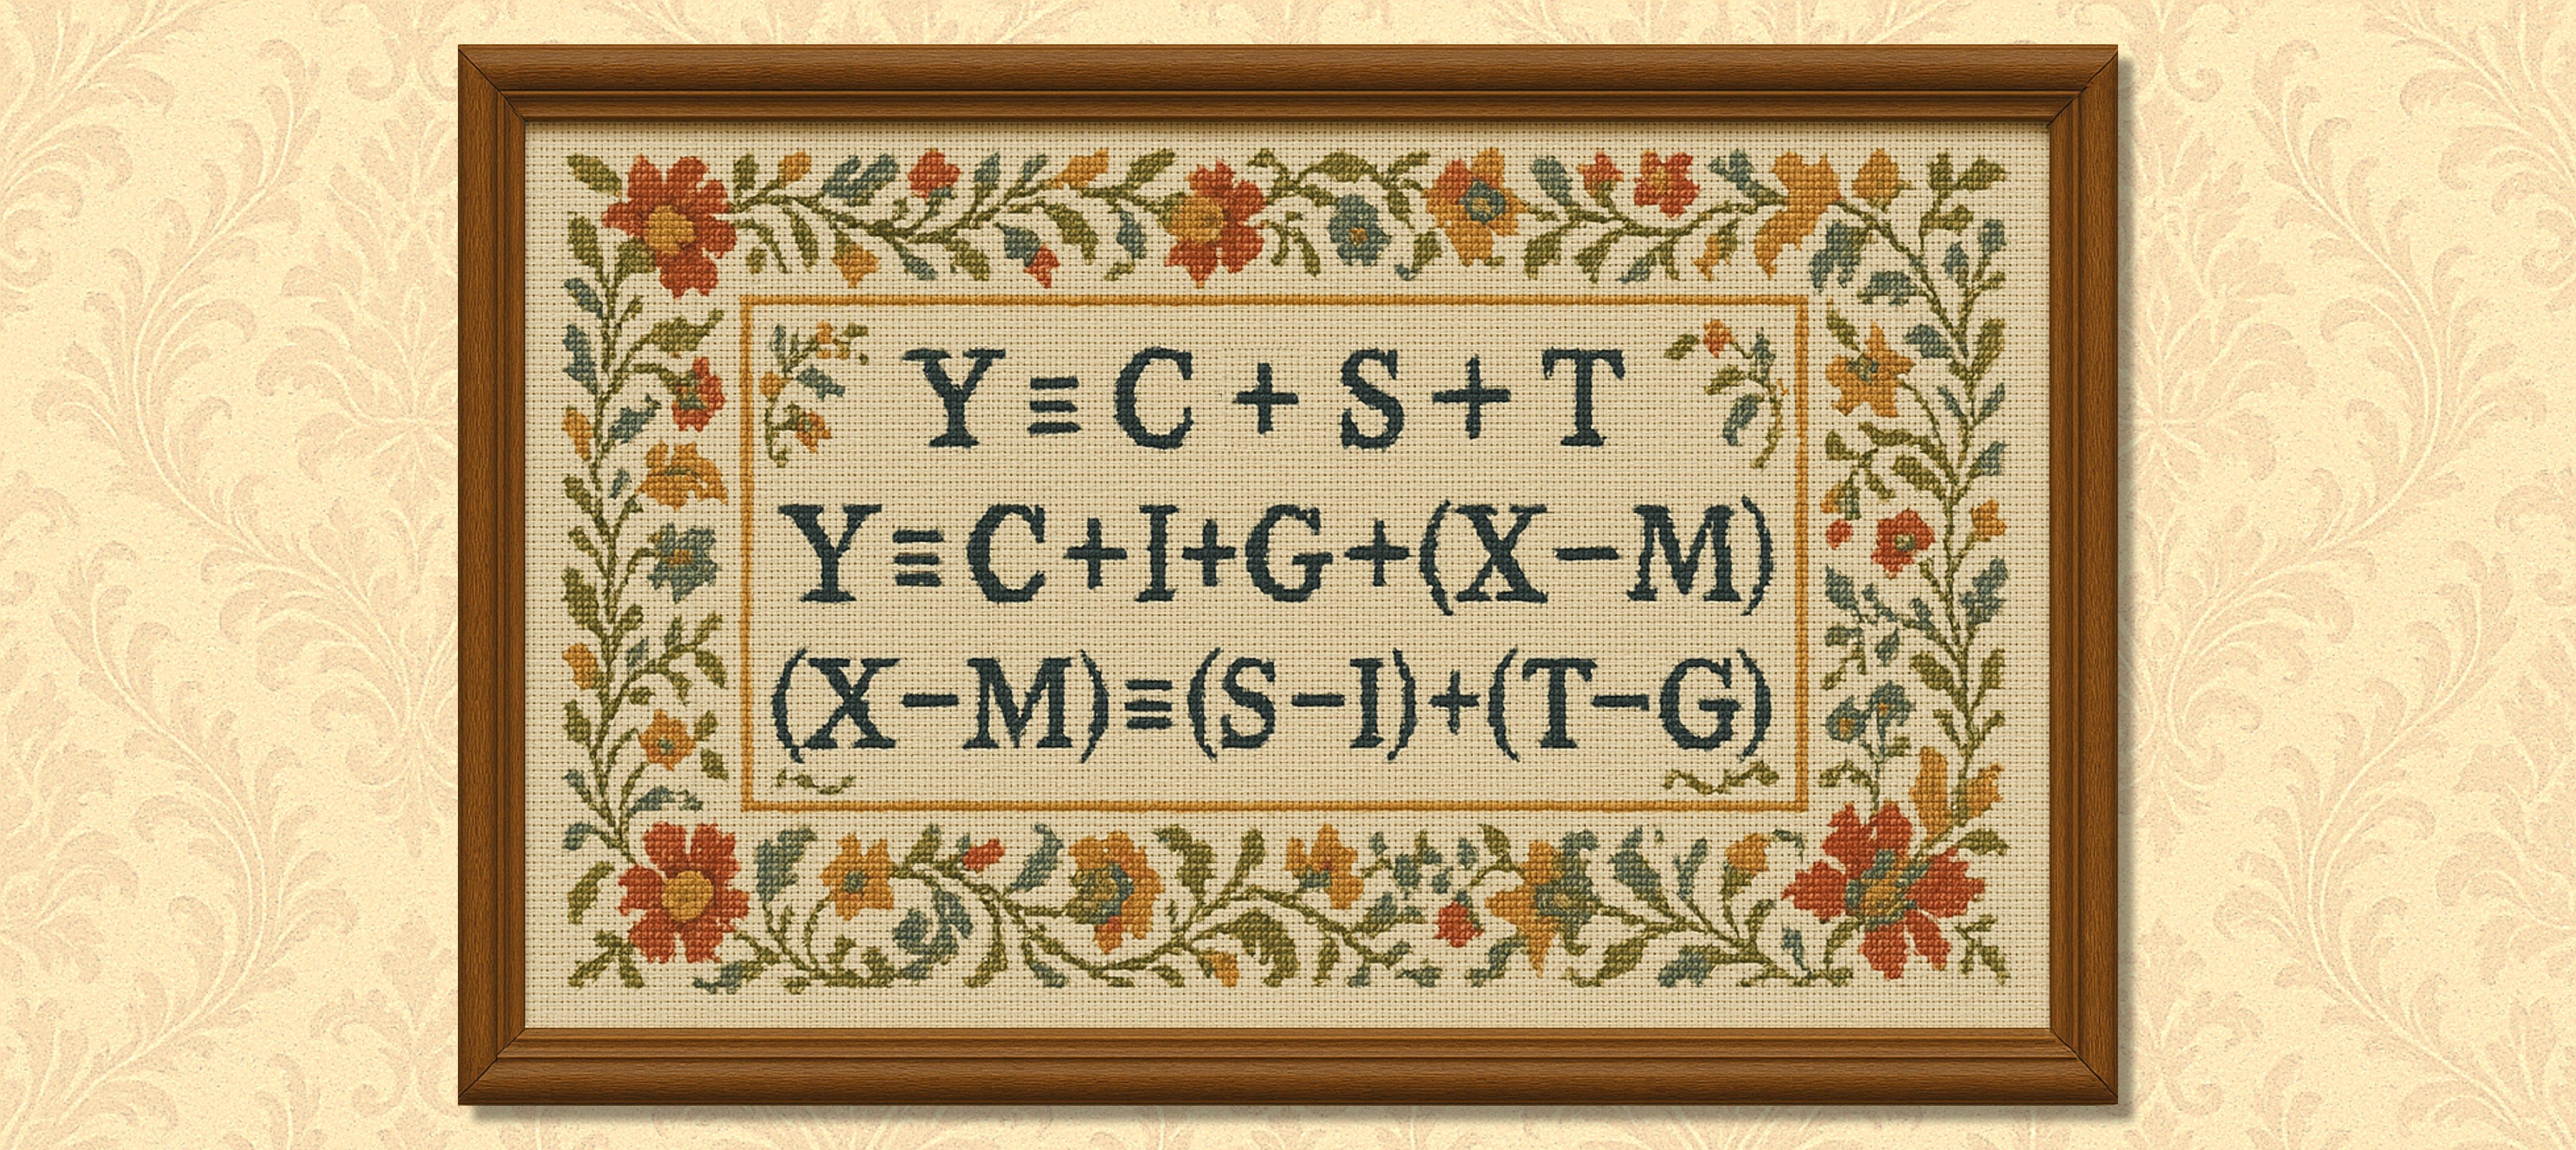
Today’s essay revolves around crops, so above are the equations in needlepoint, framed and hanging on the Victorian wallpaper of an old farmhouse. From top to bottom, they represent:
The Expenditure Approach to Gross Domestic Product (GDP). Every dollar of national income goes toward either consumption or saving or taxes.
The Income Approach to GDP. Every dollar of national income comes from either consumption or investment or government or exports, with imports subtracted, since they are buried in C, I, and G and do not reflect domestic income.
The Balance of Payments Identity. The trade balance exactly equals the balance of private investment and private saving (net private saving) plus the balance of government spending and taxation (the budget balance). We’ll also find that net inflows of foreign capital yield an equal balance of payments deficit, whereas net outflows of foreign capital yield an equal balance of payments surplus.
These three equations are collectively known as the National Income Accounting Identities and were natural extensions of the NIPA. They comprise an alarm system to tell policymakers and voters when their goals and policies and analyses are veering into the illogical and impossible.
When President Trump promises to spur net inflows of capital from foreign investors and promises to reduce the nation’s deficit of trade in goods and services, the third equation says he is promising to accomplish two mutually exclusive possibilities. (This assumes I am correctly interpreting his twin promises.) The incompatibility of these two promises isn’t theory or speculation or opinion or pointy-headed academic sophistry. Kuznets and his colleagues applied simple arithmetic and longstanding accounting principles to well-organized, real-world data and revealed surprising truths. No president can command these mathematical relationships to go away any more than King Canute could command the tides to recede before his throne. The equation doesn’t give a cr*p if a president is a skilled negotiator.
NOTE: Identities used the equal signs with three parallel bars, as shown in the needlepoint. For convenience, I used the standard two-bar equal signs for the remainder of this essay.
TWO TOWNS, TWO PRODUCTS, TWO ACCOUNTING ENTRIES
The NIPA are as down-to-earth as you can get. Kuznets was the most realistic of scholars. He warned that economists should not mistake GDP for a measure of happiness or well-being, and his experience in Russia made him suspicious of economic planners.
In our quest to better understand the three equations, we’ll take the principles of international trade and finance and apply them to two small towns trading two products—all placed in the framework of double-entry bookkeeping. National income accounting is just a nationwide or worldwide extension of the balance sheets and profit-and-loss statements an accountant produces for a business facing scrutiny by investors, customers, bankers, and the IRS.
Table 1 shows all economic activities and transactions in our simple economy. Hereville just grows corn, and every ton—every ear—is either eaten at meals, saved by farmers for seeds, stored by government for emergencies, or exported to Thereville. Hereville also imports wheat from Thereville, and every grain is either eaten at meals, saved for seeds (future crop diversification), or stored by the government for crises. For simplicity, the hypothetical numbers assume that corn and wheat both cost $1,000 per ton. No exotic theory—just weighing grains and recording where they go.
NOTE: All graphics were done by Graboyes with ChatGPT. Given the 1930s/1940s origins of these equations, I used a comic-book aesthetic from that era.

FINANCING PURCHASES FROM AND SALES TO THEREVILLE
Every purchase of corn or wheat must be financed by cash or credit or equity investment, and Table 2 shows the financing employed in imports and exports. Three involve differing forms of debt, and the other employs “foreign” investors from Thereville purchasing stock in Hereville’s farms.

REGROUPING INTO CATEGORIES OF INCOME
The above sorts of tables are fine when dealing with two towns and two products, but the complexities become monstrous when dealing with vast numbers of countries, products, people, and transactions. Taming that jungle was what earned Simon Kuznets the Nobel Prize in Economics (1971) and (perhaps) won World War II for America. It’s impractical to ask people to itemize all their food choices in a year or tell you which countries every item of food came from. But you can get good answers to questions like, “How much did you spend on groceries last year?” and “What were total imports last year?”
Y (1000 tons, or $1,000,000) is the size of the Hereville economy—the local equivalent of GDP. In double-entry bookkeeping, every dollar is income for someone and spending for someone else. Table 3 reorganizes the numbers from Table 1 to accord with the Income Approach to GDP equation:

So, in Table 3, we stop asking how much corn and wheat people ate—and where it came from—and simply ask, “How much did you spend on groceries?” and “How much stuff of all types did you import?” The NIPA’s developers had (and still have) furious battles over which categories to include, which transactions to count, how best to collect the data, and so forth. But the logic and principles that underlie those data are serenely constant. Table 3 shows the most widely used categories of income.
REGROUPING AND ADDING UP SPENDING
Table 4 uses the same data to fit the Expenditure Approach to GDP equation:

Notice that the information in Tables 3 and 4 is exactly the same as the information in Table 1. We’ve merely moved tonnage from one column to another. No exotic theory—just double-entry bookkeeping.
Here’s a brief (and optional!) side-note for those taking a deep dive into these numbers. There are two ways to calculate saving (S). [METHOD #1] You can simply take total income/spending (Y=$1000K) and subtract out consumption (C=$593K) and taxes (T=$260K). By definition, whatever is left is saving (S=$147K). [METHOD #2] You can start with corn that farmers save for seed ($140K). Add to that the income from wheat corn exports that they temporarily save ($100K). Then subtract the reduction in their saving when they buy wheat for consumption ($93K).
THE MAGIC: THE BALANCE OF PAYMENTS IDENTITY
And now, we come to the magic identity: (X-M)=(S-I)+(T-G). To repeat, it says, you can’t simultaneously increase net inflows of foreign capital and decrease your trade deficit (broadly defined). We’re simply matching the movements of tons of grain with the financial instruments that facilitate those movements. Table 5 requires a little mathematical prestidigitation: We know that Y=C+I+G+(X-M) and Y=C+S+T. Therefore, C+I+G+(X-M)=C+S+T. Subtracting C+I+G from both sides gives you (X-M)=(S-I)+(T-G).

In each column, a positive number is defined as a surplus and a negative number is a deficit. Contrary to popular perception, the words “deficit” and “surplus” do not in any way equate with “good” or “bad.” (A recent essay of mine compared fear of deficits to ancient people’s fears of solar eclipses.) So, what do the numbers mean?
(S-I): Table 4 says farmers saved the $147K (the dollar equivalent of 147 tons of grain). Table 3 says farmers invested $274K. So someone other than farmers had to put up the cash to finance the excess of investment over saving ($147K-$274K=$-127K).
(T-G): Table 4 says the government received $260K in taxes. Table 3 says the government paid a total of $471K for food to store in the warehouse. So someone other than the government had to put up the cash to finance the excess of government spending over taxation ($260K-$471K=$-211K).
(S-I)+(T-G): Hereville’s private and public sectors are both running deficits, which means the town has to turn (on net) to “foreign” investors from Thereville to finance their deficits. (S-I)+(T-G)=$-338K. This exactly equals the trade deficit—the amount of corn going out minus the amount of wheat coming in.
Net capital inflows=trade balance: In Table 2, Thereville investors are entrusting +$438K to the private and public sectors in Hereville, and Hereville investors are entrusting +$100K to entities in Thereville. So the net flow of “foreign” capital investment into Hereville equals +$338K. This is exactly equal to the trade deficit.
POSSIBLE CAUSES OF CAPITAL INFLOWS AND TRADE DEFICITS
There are multiple reasons why Hereville could be experiencing capital inflows and a trade deficit. Here are four possibilities, none of which involve Hereville being “ripped off” or “losing our edge in agriculture”:
HEREVILLE’S ECONOMIC STRENGTH: Capital might be flowing from Thereville to Hereville because investors in Thereville think Hereville is a better place to invest. In such a case, the trade deficit is simply a symptom of Hereville’s strength in the eyes of Thereville’s investors.
INVESTMENT IN THE FUTURE: Hereville’s farmers and government might be storing grain to enable future economic growth and food security. In this case, the trade deficit is driving the capital flows.
REBUILDING AFTER DISASTER: Perhaps Hereville recently suffered floods that destroyed their supplies of seed and emergency food. To rebuild, they have to receive investment capital from Thereville.
DEMOGRAPHICS: Perhaps Hereville has experienced a baby boom, and all those kids need a lot of food, while Thereville has an older population that is trying to lose their beer-bellies. In the real world, younger people borrow money, and older people pay off debts. Hence, older folks lend money to younger folks or purchase equity in the younger folks’ endeavors. Such demographic differences also exist at the national level.
ALTERNATIVE SCENARIOS
Finally, now that we know the miraculous Balance of Payments Identity, let’s try out five different configurations of numbers:
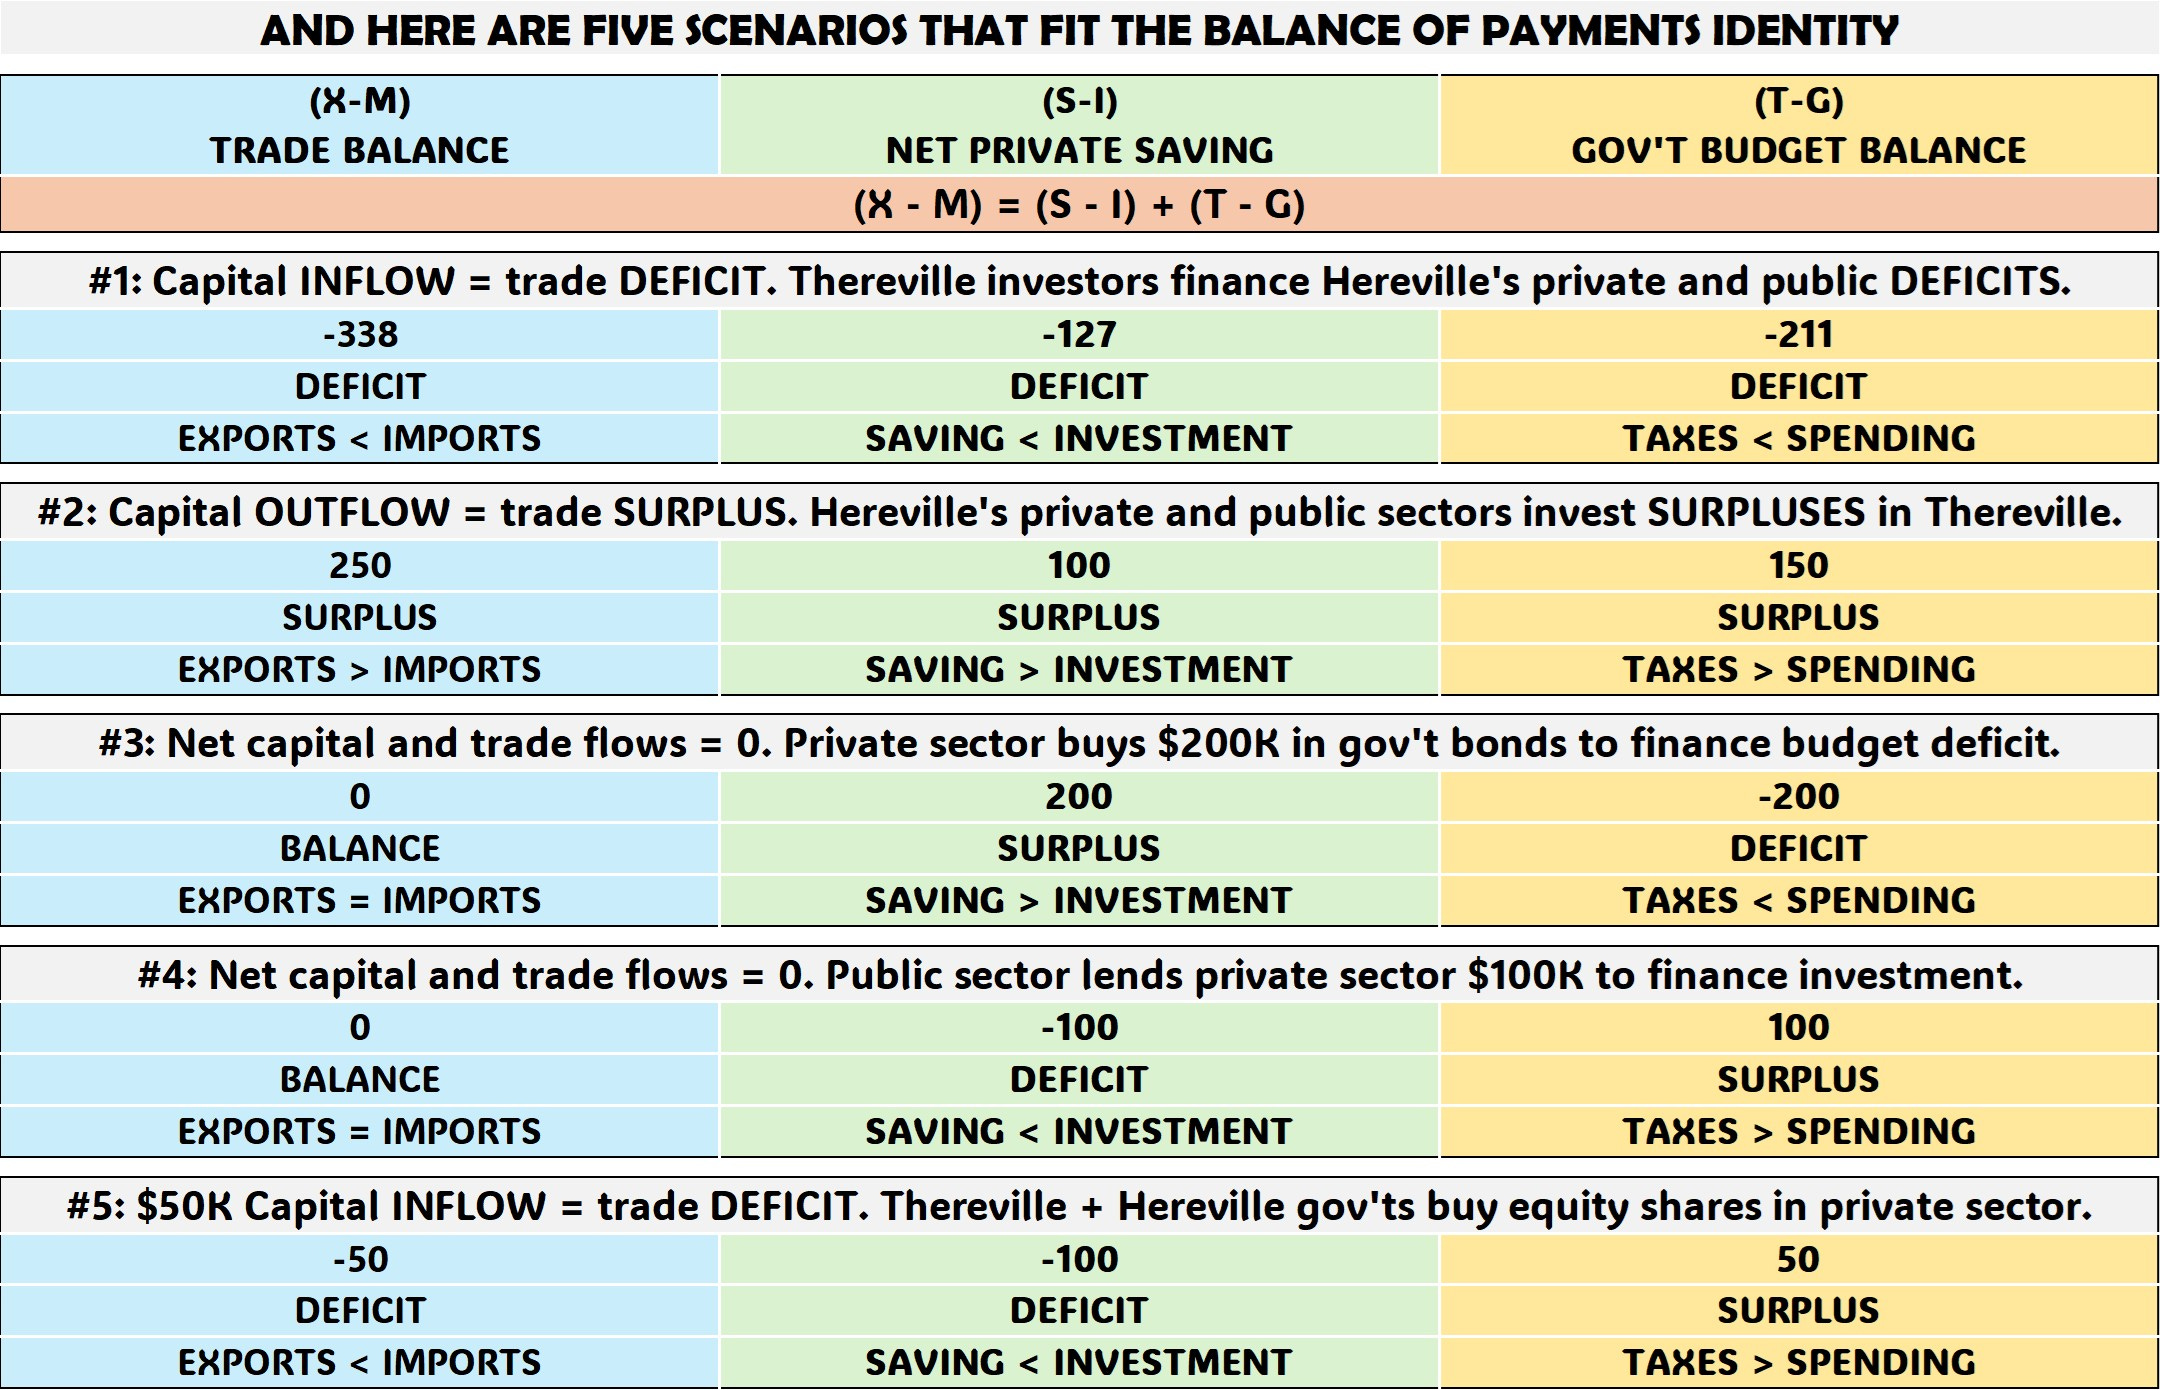
Scenario #1 is the base case described in Tables 1 through 5. Hereville farmers and government are running deficits, so Thereville investors step in to finance them.
Scenario #2 is the opposite. Hereville farmers are investing less than they save, and Hereville’s government is spending less than it taxes. Thus, both have extra cash, and both invest (lending or equity) in Thereville.
Scenario #3 has net capital and trade flows between Hereville and Thereville at zero. There might be exports and imports, accompanied by capital inflows and outflows, but they’re perfectly balanced. Hereville’s government is running a deficit, but Hereville’s farmers have extra cash and buy municipal bonds to cover the government’s obligations.
Scenario #4 is similar to #3, with zero net flows between Hereville and Thereville. But here, the farms are investing more than they are saving. The government is running a surplus and lends the excess cash to the farmers to pay for their investment.
Scenario #5 is a hybrid case. Once again, farmers are investing $100K more than they are saving, so someone else needs to finance it. In this case, though, the governments of Thereville and Hereville each buy $50K in stock in Hereville’s farms. So, here, farmers don’t incur any debts, but they must share future profits with the two governments. This is similar to President Trump’s idea of a sovereign wealth fund. (FYI: I think a sovereign wealth fund is an awful idea, but that’s another topic for another day.)
BASTIAT’S WINDOW publisher Robert F. Graboyes is an economist, journalist, and musician whose five degrees include a PhD in economics from Columbia University. An award-winning professor, he received the Reason Foundation’s 2014 Bastiat Prize for Journalism. His musical compositions are on YouTube.
I love these posts! I used the earlier ones to help clarify a presentation I did, and was able to shock a PhD candidate in one of the lesser disciplines (i.e. not economics) into saying maybe he should learn some economics. And as an amateur history buff, I love your piece on Kuznets and WWII. I think you are right, national income accounting is more important than the atom bomb!
Masterful, Robert. I would like to recruit your wonderful writing to Threesville, https://www.amazon.com/Morality-Capitalism-Dialogue-David-Kendall/dp/1503233243 . I believe you could bring it to life far more than I have so far.